Rigol's MSO8000 series of oscilloscopes were announced in mid-2019 as high-end models using the same general architecture as the DS7000 and lower cost MSO5000 units. The standout feature is the 2 GHz analog bandwidth, with a reasonably capable 10 GS/sec capture rate into a 500 Mpoint buffer.
I was fortunate enough to find a new old stock MSO8204 going for an 80% discount off MSRP near the end of 2024. Staying true to the Rigol badge, it's an incredibly capable scope for just under AUD$4k, but some of the software does feel quite a bit less polished than the prestige T&M brands.
Automated measurements
I rely heavily on being able to setup and run automated measurements for PCB design verification and documentation. The complexity of these setups can be as simple as logging temperatures, to sweeping power supplies while modulating a digital load to test voltage regulators, or exploring large multi-variable operating ranges to build confidence in the design's stability in scenarios ranging from typical usage patterns to industrialised abuse.
The most widely used interfaces for electronics test equipment are SCPI over a networked interface or serial port, USBTMC, or sometimes older gear needs GPIB.
Today's rant is about the sub-par performance of waveform readout over the network interface - I noticed that moderate depth waveform captures were taking minutes to stream to my computer for subsequent analysis and wanted to work out why.
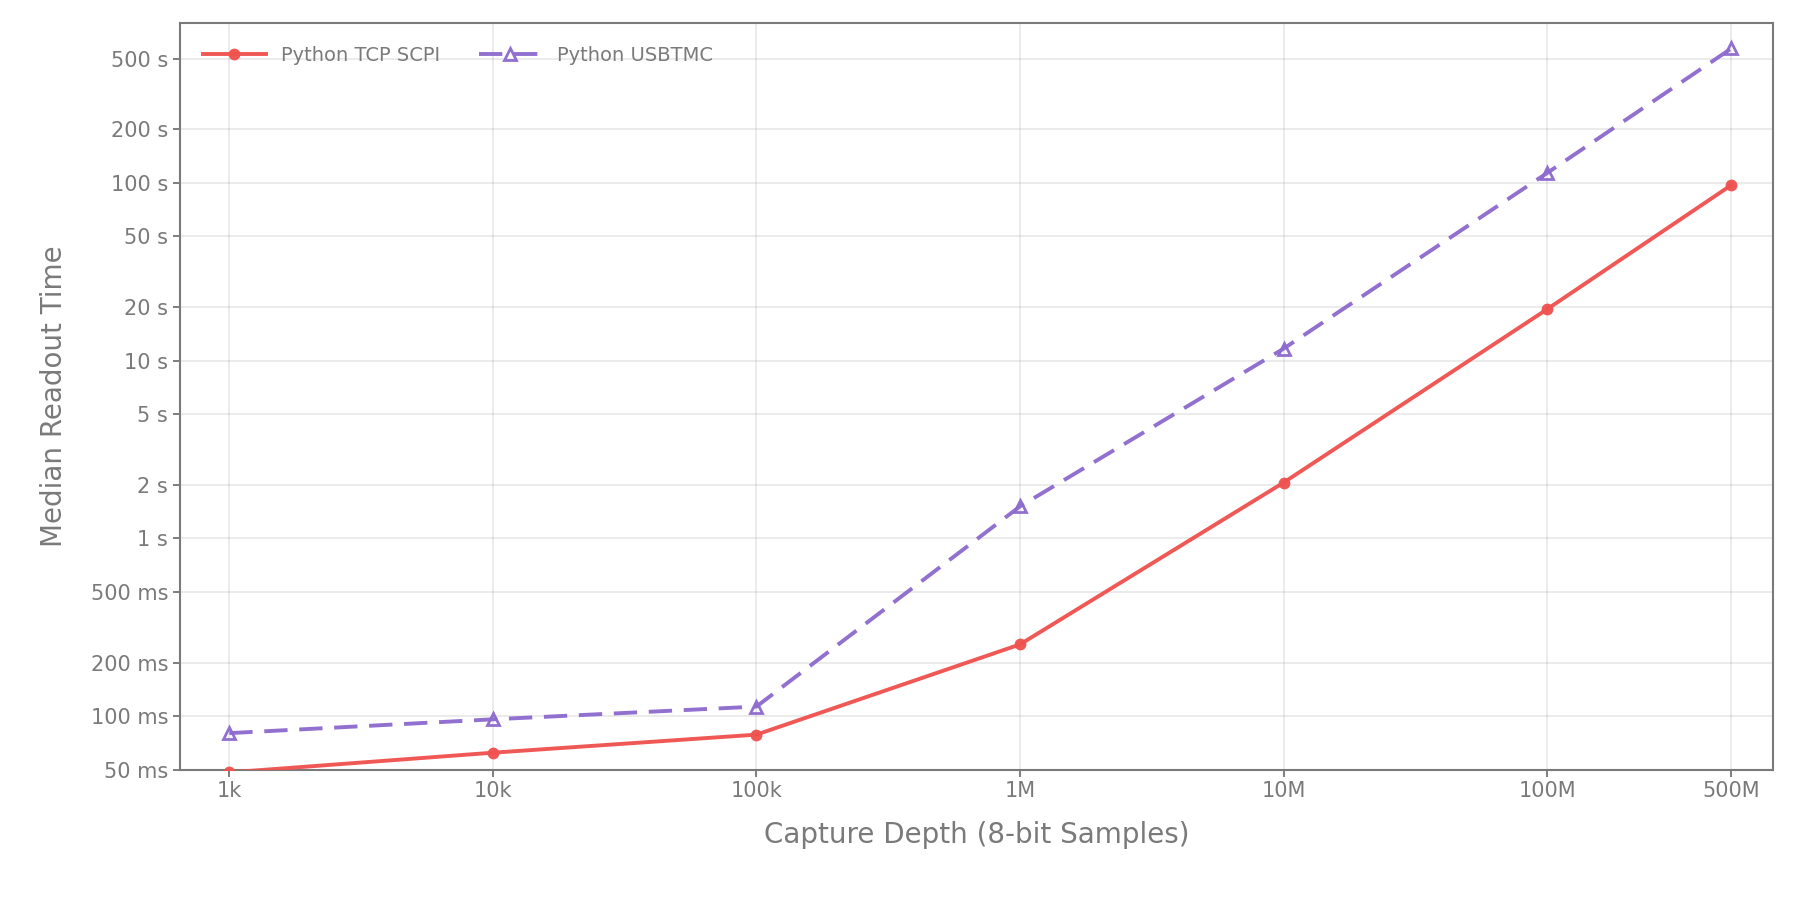
The maximum throughput over the gigabit Ethernet port was around 4.8 MiB/s, while the USB2 TMC interface seemed to cap out at 800 KiB/s with python-usbtmc. Exporting a single channel's 500M capture to CSV on the scope takes 15 minutes!
So the plan is to figure out what throughput the interfaces are capable of, why the default performance is so poor, and hopefully find a solution to stream data out faster!
Ultravision II architecture
Before getting too deep into the weeds I wanted to see if the upper-bound might be limited by the architecture, processor or network stack. I've previously explored Rigol's RSA spectrum analysers with Ghidra so I have some starting familiarity with how Rigol designed this era of equipment. I'm also not starting from zero for this scope:
- I can SSH into my unit using
rigol:rigolcreds. - It's running a fairly old
3.12Linux kernel, and busybox tools - A VNC server is running on port 5900, telnet style SCPI on port 5555.
- The basic info/control web interface is provided by
lighttpd/1.4.33
There's also some prior art in this short EEVBlog thread and mensi's blog has some experiments with a cross-compiled 'hello-Rust' on the MSO5000, and the EEVBlog 7000 series teardown shows what a very similar internal layout would look like.
I've tried to make an overview of the system from a scattered mix of Rigol's press releases about their Phoenix analog front-end design and UltraVision digital architecture, as well as the service manual, declassification guide, teardown photos, Ghidra sessions, poking registers on the hardware, and trying to reverse engineer parts of the FPGA bitstreams.
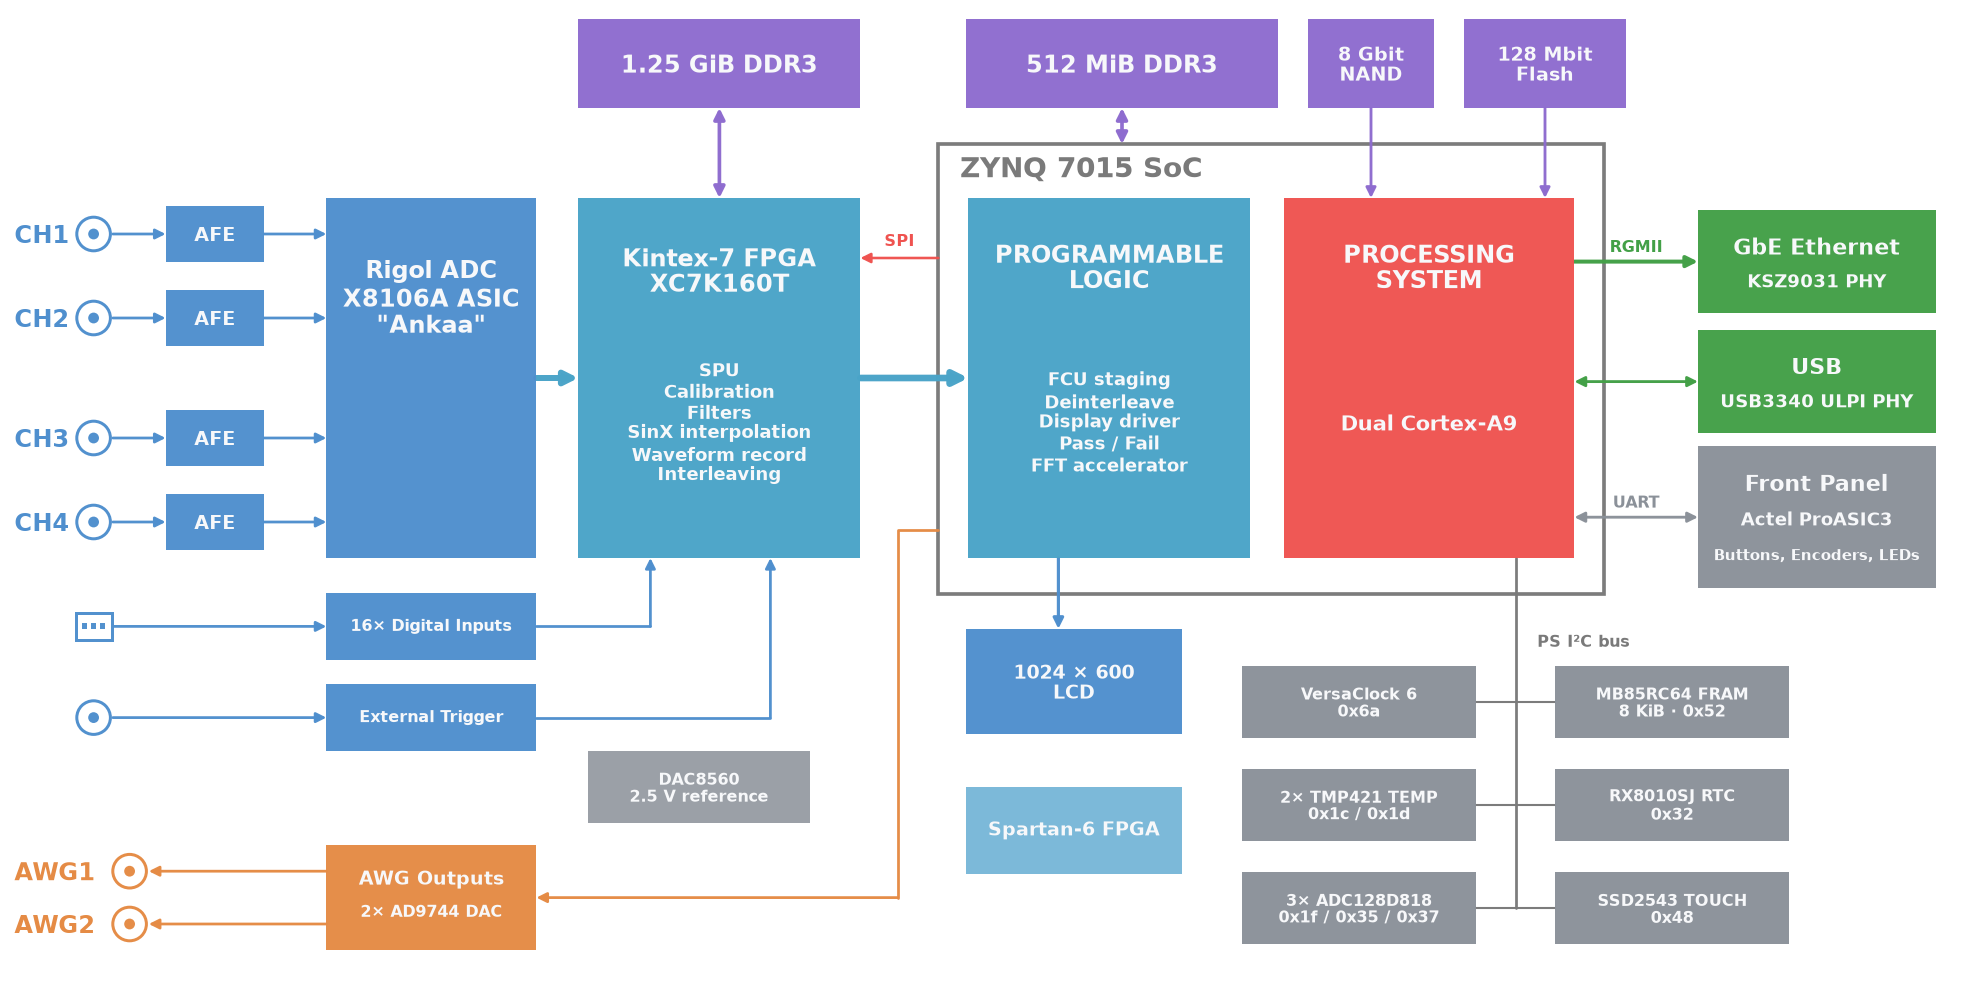
The acquisition side uses Rigol's custom ASICs for the Analog Front End (AFE) and Ankaa ADC followed by a beefier XC7K160T-676 Kintex-7 FPGA for triggering, processing and short-term storage of capture data. There's also a Spartan 6 FPGA on the board for glue-logic which might be between the Zynq's SPI0 and the Kintex, hinted at by Rigol's spi2cpld utility on the Linux side.
The applications processor in these units is responsible for running the main software and UI that is presented on the unit along with the user-facing IO. They've used a Xilinx (now AMD) Zynq 7015 system-on-chip which has a 'Processing System' (PS) which is a pair of ARM A9 cores in hard silicon clocked at 866 MHz (they splashed out for -3 speed grade), along with 'Programmable Logic' (PL) which is an FPGA fabric.
The 512 MiB of DDR3 attached to the Zynq has 64 MiB reserved for the hardware side to use, and Linux gets the lower 448 MiB. Because it's smaller than the capture buffer we can expect samples to be fetched from the Kintex's buffer RAM in smaller chunks as they're needed for the outgoing SCPI packets.
A high-speed interface connects the Kintex to the Zynq's PL using four SerDes transceivers. They are often used for PCIe, SATA, and network interfaces but the underlying hardware flexibility allows a whole ecosystem of domain-specific options like JESD204, Aurora, and custom vendor protocols. I don't know what Rigol have opted to use, but all of these approaches try to move data without CPU involvement.
Zynq GTP transceivers run between 0.5-6.6 Gb/s per lane, so the CPU and it's external interfaces are likely to run out of headroom before the FPGA-FPGA bandwidth becomes an issue.
Is the network interface capable of more?
To check the performance of a network interface I usually reach for iperf. Years ago I spent several days trying to squeeze out ~700 Mbps from a Zynq devboard, and comments online also seem to hit similar limits with the PS GEM[1]. I'm expecting similar performance from this scope but fully expect that memory contention, background tasks and AXI throughput while running 'everything else' might bring that down a bit.
I cross-compiled for the scope, -O3 -march=armv7-a -mtune=cortex-a9 -mfpu=neon, with statically linked dependencies to suit the minimal busybox image which I scp over to the scope.
Accepted connection from 192.168.1.145, port 41626
[  5] local 192.168.1.152 port 5201 connected to 192.168.1.145 port 41627
[ ID] Interval           Transfer     Bitrate
[  5]   0.00-1.00   sec  72.0 MBytes   604 Mbits/sec            (omitted)
[  5]   1.00-2.00   sec  78.8 MBytes   661 Mbits/sec            (omitted)
[  5]   0.00-1.00   sec  78.5 MBytes   658 Mbits/sec
...
[  5]  14.00-15.00  sec  79.5 MBytes   667 Mbits/sec
[  5]  15.00-15.07  sec  6.00 MBytes   692 Mbits/sec
- - - - - - - - - - - - - - - - - - - - - - - - -
[ ID] Interval           Transfer     Bitrate
[  5]   0.00-15.07  sec  1.17 GBytes   665 Mbits/sec            receiver
Pretty much what I expected given some minor IRQ activity on the main core. Stopping the Rigol app improves transmit performance by ~7%, and moving the test to Core 1 to avoid IRQs helps a tiny bit.
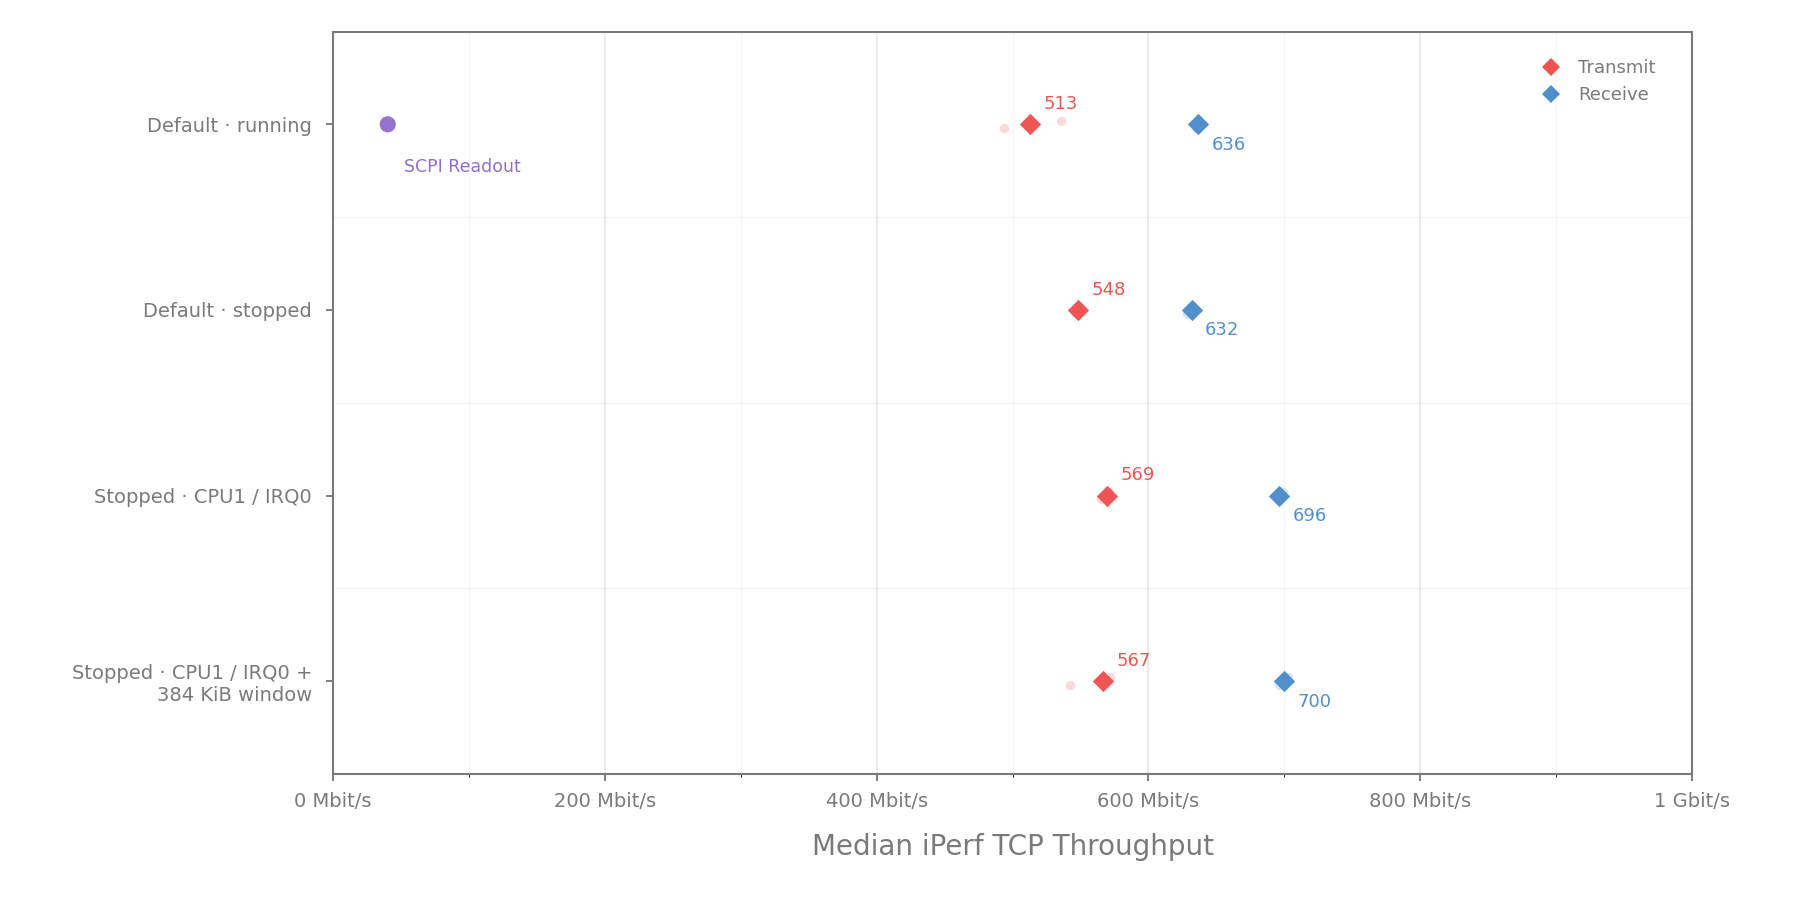
Poking the GEM registers to check configuration against performance recommendations, it seems that hardware CRC offload, reasonable buffers, and burst settings were already enabled. So there's not much I'm aware of that could improve the network throughput ceiling without the hardware designers running Ethernet from the PL.
This is still 16x faster than the Rigol's SCPI performance, so a dumpcap later I was able to confirm that network performance was fine and the application just takes a 200 ms break between each burst of 1 Mpoints.
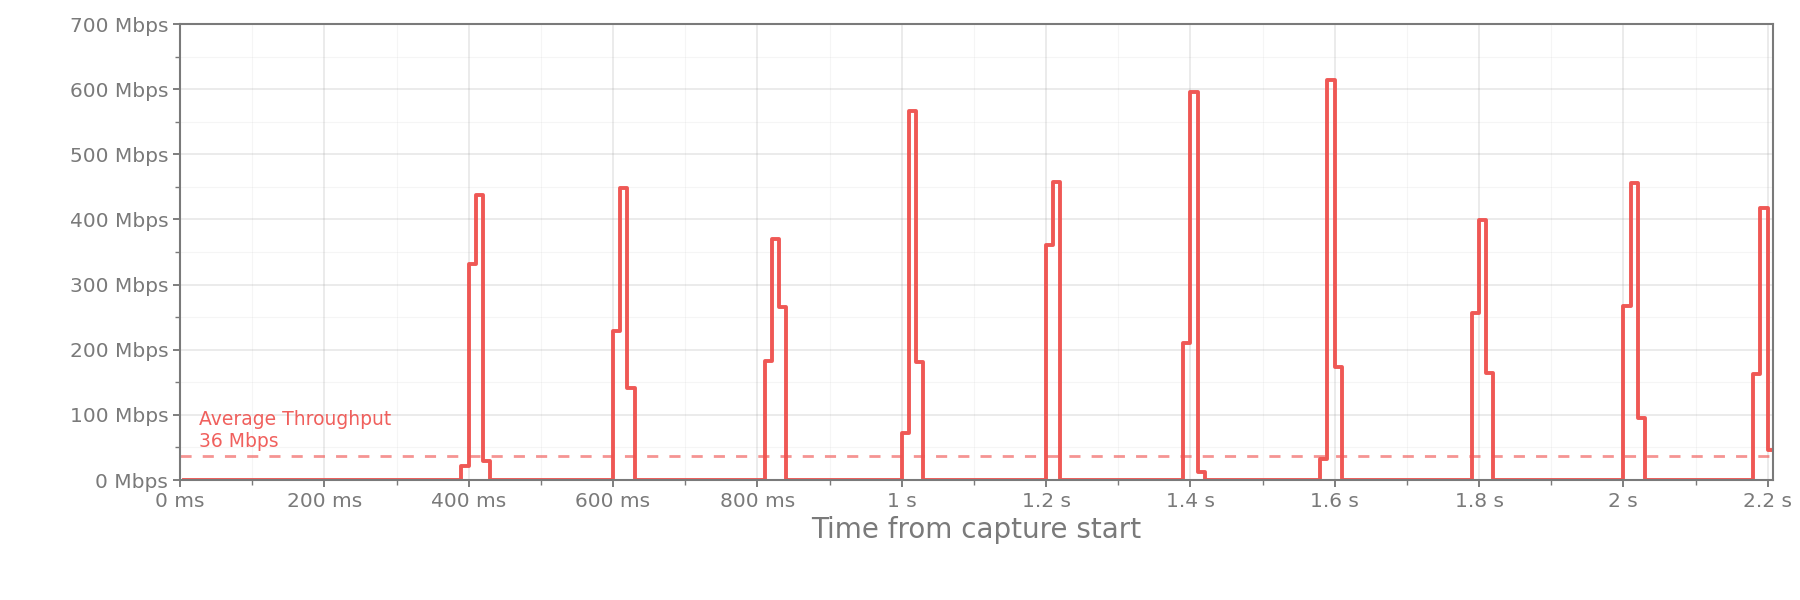
So let's see what can be done about fixing that!
Binary analysis with Ghidra
To get samples out of the scope faster, we need to know where to find the data in the first place.
Finding strings of text in the main application binary is fairly trivial, and because SCPI is ASCII based this means finding relevant functions should also be fairly easy.
After the scope has triggered, we put it into STOP mode to freeze the waveform capture memory so we have as much time to configure and read samples as we need. The SCPI command/response flow:
:STOP                         // Freeze the completed acquisition
:WAV:SOUR CHAN1               // Select channel 1
:WAV:MODE RAW                 // Use capture memory rather than the displayed trace
:WAV:FORM BYTE                // Unsigned byte per sample
:WAV:STAR 1                   // Start at the first sample (inclusive)
:WAV:STOP 1000000             // End at one million points

:WAV:PRE?                     // Request the time and voltage scaling metadata
    0,2,1000000,1,4.000000E-10,-1.000000E-1,0.000000,4.1361E-03,0,128
    // BYTE,RAW,points,count,x-increment,x-origin,x-reference,y-increment,y-origin,y-reference

:WAV:DATA?                    // Fetch the selected samples
    #9001000000 80 7f 7f 80 80 80 80 ...
    ││└───┬───┘ └──── // sample payload
    ││    └────────── // 9-character length
    │└─────────────── // ASCII header length
    └──────────────── // IEEE 488.2 definite-length block marker
:WAV:PREamble?is a short-cut that returns 10 fields in one request, e.g. could have used:WAV:YINCrement?to fetch4.1361E-03.
Because the setup commands and preamble are small, we mostly care about what the scope is doing while building the response to the :WAV:DATA? request (the hot loop I want to optimise).
I can find these commands in the XML files describing the tree, but the main /rigol/appEntry Qt application is where any handling logic is going to be. Grab a copy of the 26 MB 32-bit ARM program off the scope's file system, or extract it from a firmware update file. For anyone playing along at home, I'm playing with version 00.02.02.00.01.
The symbols are stripped as expected but it does contain loads of class names, diagnostic strings, command tables, embedded UI images and error-messages so I was fortunate that finding the 'fun' didn't need me to piece it together from the edge-pieces.
The SCPI handling was fairly quick to find, and a lot of similar strings reference wave_formater.cpp, servwfmdata.cpp and eventually lead to CWaveFormater at 0x004683ec. After a bit of sniffing around and manually labelling things, we have an idea of how the response buffer is filled.
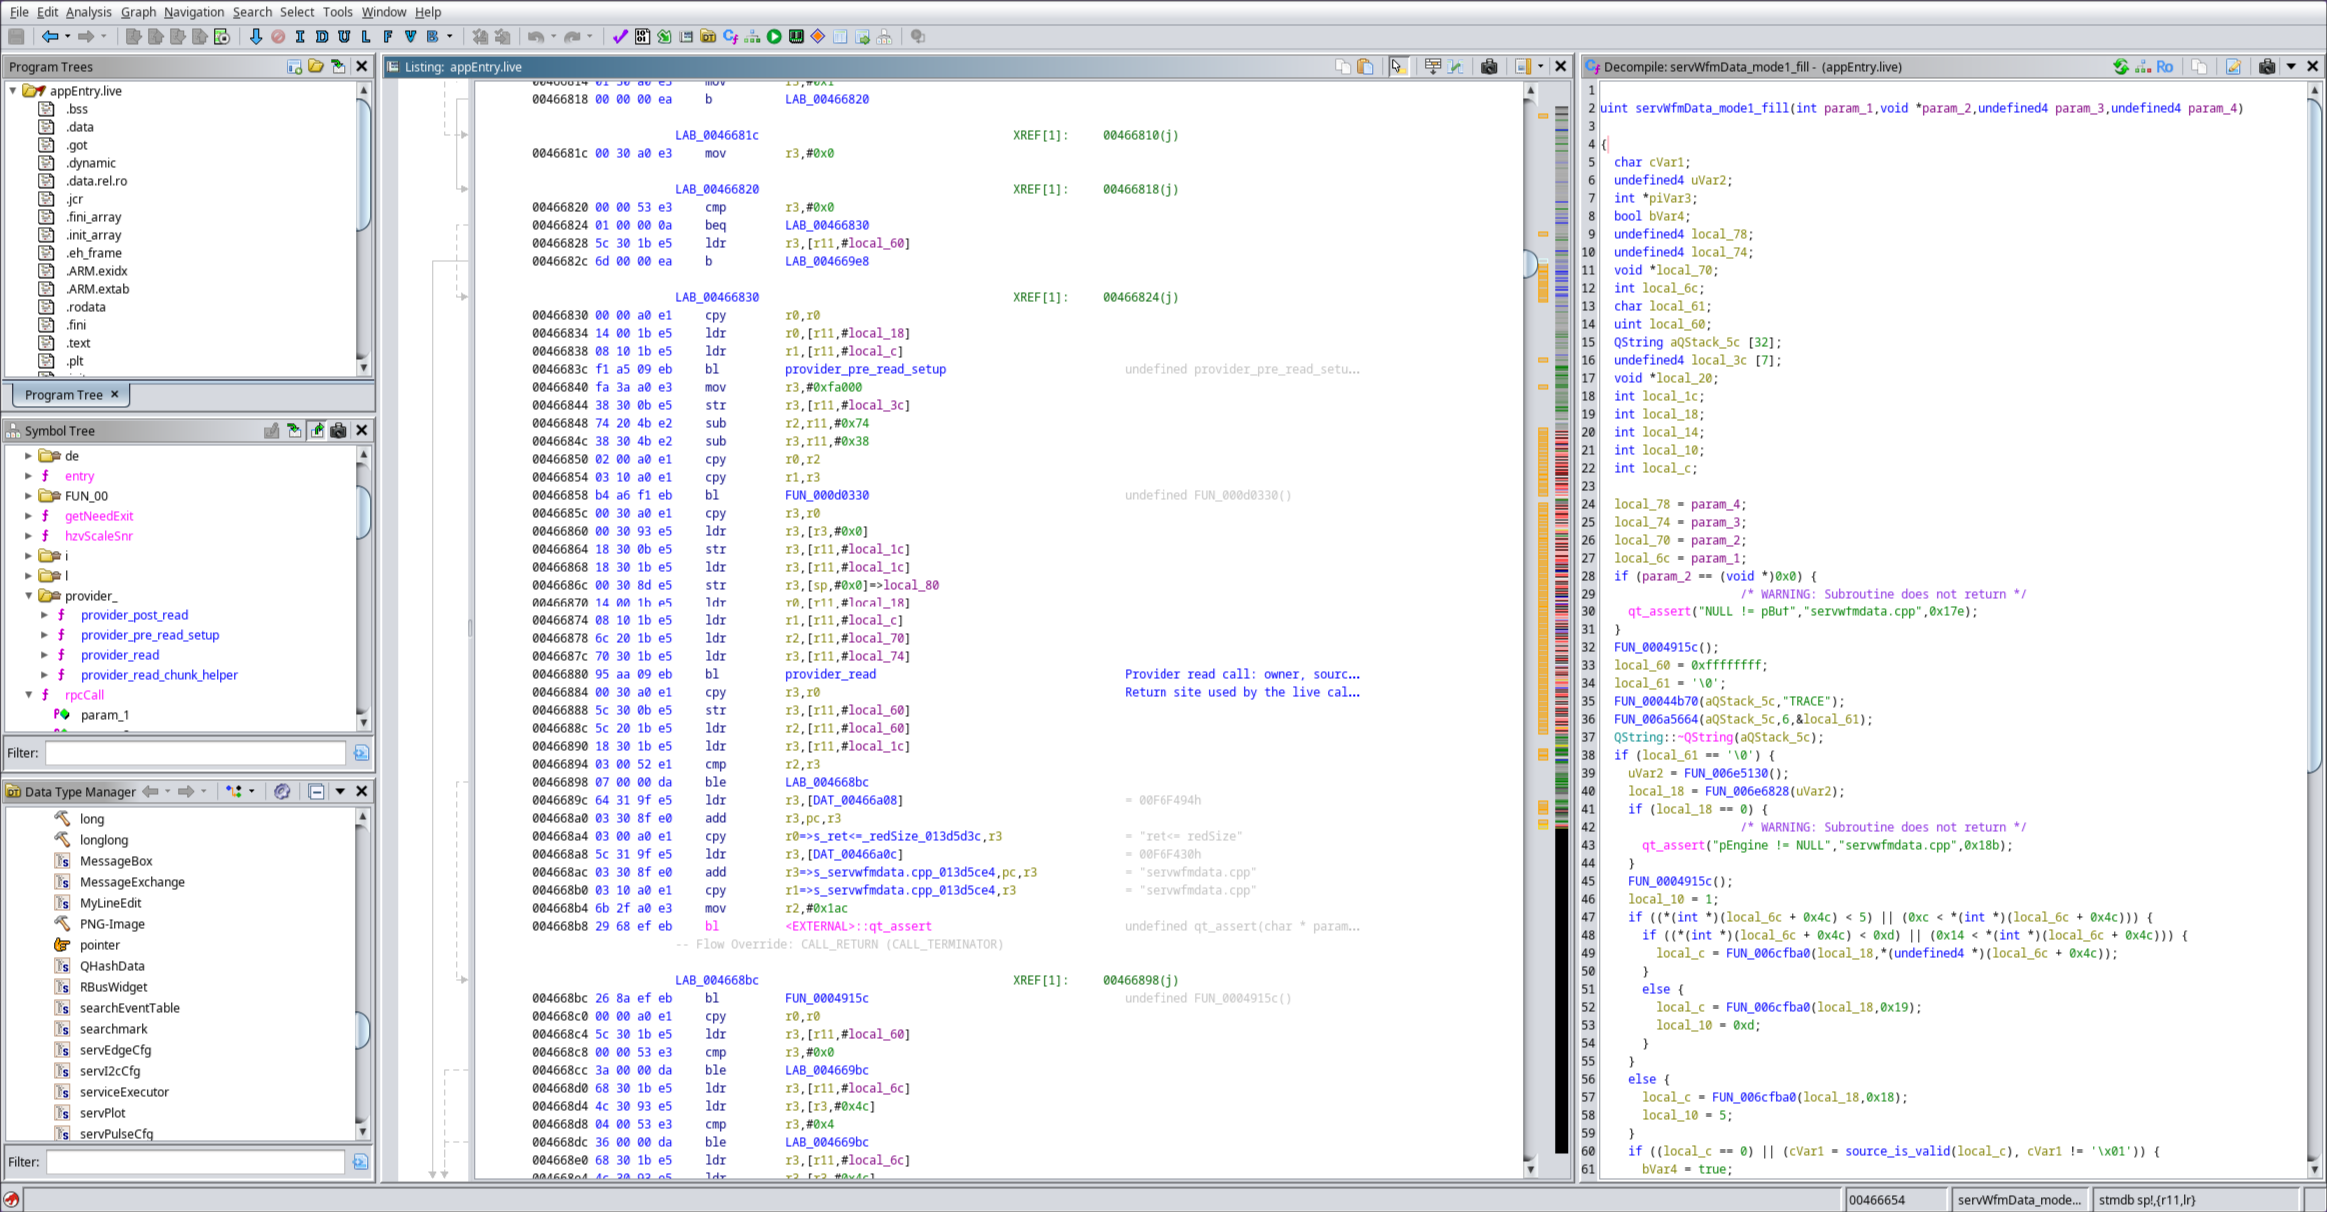
The previewed de-compiled code can be a bit hard to read, simplified for readability it's basically just:
int servWfmData_mode1_fill(Service *service, uint16_t *dst, uint32_t start, uint32_t count)
{
    Source *source = resolve_source(service);
    if (!source || !source_is_valid(source))
        return 0;

    provider_pre_read_setup(service->owner, source);

    count = min(count, 0x0fa000);    // enforcing 1,024,000 max samples
    int copied = provider_read(service->owner, source, dst, start, count);

    provider_post_read(service->owner, source);
    return copied;
}
Some strings suggest the source file on Rigol's side might be dsoengine_memory.cpp, but I've named the call at 0x00466880 provider_read() for lack of any better options.
Naming variables and functions is hard enough when I'm the one writing the code.
provider_read() is worth a deeper look though. On a beefier system a software developer might expect a pointer to a large buffer but this hardware has 64MiB to play with, so it's asking the hardware-side to send a small chunk of samples across to the Zynq's PL. There's two stages to the internal behaviour,
- Program the source offset and sample count, kick several FPGA-looking blocks, then wait for a ready condition
- Those hardware registers have loose correlation with nearby strings
IPhyWpu,IPhyTpuandIPhySpu - There's C++ abstractions over PL address ranges inside
dso_phy::IPhyWpuetc. - Best guesses on their roles are selection/preparation for a FPGA-FPGA transfer from the capture memory to the Zynq.
- Those hardware registers have loose correlation with nearby strings
- Starts a de-interleaving operation and waits for
IPhyTrace::isDeinteDone(...)
It's pretty common for multi-lane or fast interfaces to interleave or parallelise data from different channels or buffers during transport. Later on they need to be re-arranged into linear arrays that higher level software engineers expect.
After the de-interleaving is done, the IPhyTrace interface returns a memory address which the Qt application maps and copies into its heap buffer. The overall flow is:
CWaveFormater internal RPC command 19

servWfmData command-19 handler
Stopped/RAW mode-1 fill
    Provider pre-read setup
    Provider read
         Source seek
         Setup/wait 1
           Program FCU source offset and length
           Kintex memory -> Zynq staging memory
         Setup/wait 2
           TPU/deinterleave processing (on Zynq PL?)
         IPhyTrace request
           Map physical channel window
           memcpy into appEntry uint16_t buffer
     Formatter
       Compact BYTE data and construct SCPI block
I'm now confident that I've read the tea-leaves enough to understand the basic operation, but the exact behaviour isn't known because code uses a handful of run-time variables dictating the size/number of requests made to the Kintex capture memory and how the buffer is provided to the application. So now it's time to find out if that's happening on the hardware.
Dynamic tracing on hardware
When you find yourself run-time patching software on an oscilloscope that's worth more than your car, the process deserves some paranoia. If you try to replicate any of this, the health of your hardware is entirely dependent on your skill at not making unlucky choices!
One of my personal red-flags is searching for this kind of risk, just to feel something.
Rigol were nice enough to leave /usr/bin/gdbserver in the system image from a 2011-era arm-xilinx-linux-gnueabi toolchain but I had some reliability issues with remote attach and ended up writing a ptrace helper that runs on the scope.
pid=$(pidof appEntry | awk '{print $1}')
/tmp/bp_trace "$pid" 12 0x00466880:servWfmData_read_call 0x00466884:servWfmData_read_ret
It doesn't replace using a proper debugger, but a small tool is fine for the amount of time I'll be using it.
At a high level:
- During startup, do some small safety checks
- Pause the
appEntrythreads so it's not running while we patch it - Save the instruction
0xeb09aa95(BLprovider_read) at0x00466880 - Temporarily replace it with ARM software-breakpoint instruction,
0xe7f001f0 - Also save/replace the return instruction,
0xe1a03000(MOV r3,r0) at0x00466884 - Continue running
appEntry, waiting for the breakpoint to hit
More detailed Call/return breakpoint process and code
The instruction at 0x00466880 is a BL (branch with link) which writes the address of the next instruction into the link register LR.
That address is 0x00466884 which is where execution resumes after provider_read() returns. I place the second breakpoint there:
- The first trap to save the function arguments before the call
- The second trap to get the return value and read the destination buffer memory.
A software breakpoint works by temporarily overwriting the instruction at its address. So when the breakpoint hits, the original BL hasn't run yet. The tracer needs to:
- Save the register values.
- Restore the original
BL. - Move the program counter back to
0x00466880. - Resume the thread so the restored call can execute.
Normally, we'd use PTRACE_SINGLESTEP to execute the restored instruction, but this old kernel returns EIO so I need to emulate a step by stopping again at the next instruction.
The return breakpoint is conveniently already at that next address, so the restored BL branches into provider_read(), runs, then eventually returns into the second trap.
The implementation has more error handling and layers of extra readout logic grafted on as I explored, but the setup looks roughly like this:
#define CALL_SITE   0x00466880
#define RETURN_SITE 0x00466884


compatibility_checks(pid);

// tids[] is from /proc/<pid>/task
for( int i = 0; i < thread_count; i++ ) {
    ptrace(PTRACE_ATTACH, tids[i], NULL, NULL);  // Ask the kernel to stop this thread
    waitpid(tids[i], &status, __WALL);           // Wait for it
    ptrace(PTRACE_SETOPTIONS, tids[i], NULL, PTRACE_O_TRACECLONE);
}

// ~29 threads, but they share code mapping so only needs to be patched once
pid_t patch_tid = tids[0];

// Save the existing call instruction
call_bp.original = ptrace(PTRACE_PEEKTEXT, patch_tid, CALL_SITE, NULL);

// Replace it with ARM soft-breakpoint instruction
ptrace(PTRACE_POKETEXT, patch_tid, CALL_SITE, 0xe7f001f0);

// Repeat for the return instruction
return_bp.original = ptrace(PTRACE_PEEKTEXT, patch_tid, RETURN_SITE, NULL);
ptrace(PTRACE_POKETEXT, patch_tid, RETURN_SITE, 0xe7f001f0);

// Let appEntry run again
for( int i = 0; i < thread_count; i++ ) {
    ptrace(PTRACE_CONT, tids[i], NULL, NULL);
}
Then for the happy path, I can observe registers and memory around provider_read()
// Breakpoint replacing BL provider_read
pid_t hit_tid = waitpid(-1, &status, __WALL);
ptrace(PTRACE_GETREGS, hit_tid, NULL, ®isters);
if( registers.uregs[ARM_PC] == CALL_SITE ) {
saved_call.owner = registers.uregs[0]; // R0
saved_call.source = registers.uregs[1]; // R1
saved_call.destination = registers.uregs[2]; // R2
saved_call.start = registers.uregs[3]; // R3
saved_call.count = ptrace(PTRACE_PEEKDATA, hit_tid, registers.uregs[ARM_SP], NULL);
// Put the real BL back and rewind PC so it actually executes
ptrace(PTRACE_POKETEXT, hit_tid, CALL_SITE, call_bp.original);
registers.uregs[ARM_PC] = CALL_SITE;
ptrace(PTRACE_SETREGS, hit_tid, NULL, ®isters);
ptrace(PTRACE_CONT, hit_tid, NULL, NULL);
}
// provider_read() now runs and eventually returns to 0x00466884
waitpid(hit_tid, &status, __WALL);
ptrace(PTRACE_GETREGS, hit_tid, NULL, ®isters);
if (registers.uregs[ARM_PC] == RETURN_SITE) {
unsigned long copied = registers.uregs[ARM_R0];
// Access memory at the destination address
char mem_path[64];
snprintf(mem_path, sizeof(mem_path), "/proc/%d/mem", hit_tid);
int memfd = open(mem_path, O_RDONLY);
// Read the buffer out
size_t bytes = copied * sizeof(uint16_t);
pread(memfd, waveform, bytes, saved_call.destination);
close(memfd);
// Restore original instruction
ptrace(PTRACE_POKETEXT, hit_tid, RETURN_SITE, return_bp.original);
// Rewind PC so the restored instruction executes after detach.
registers.uregs[ARM_PC] = RETURN_SITE;
ptrace(PTRACE_SETREGS, hit_tid, NULL, ®isters);
}
// Stop all the other threads, detach, continue appEntryWhen the processor tries to execute one of those instructions after I've sent a SCPI request for 1000 points, Linux stops the thread and gives control back to the trace program so I can poke around memory before resuming normal execution.
ARM's 32-bit procedure-call standard means that the first four function arguments arrive in r0 through r3, with the rest at the start on the stack. Looking at my cleaned up provider_read() definition from Ghidra, the trace tool sniffed these values during the breakpoint:
call 0x00466880 r0=0x02e10940 r1=0x04316fb0 r2=0x05071b60 r3=0 [sp]=1000| Register Location | provider_read() arguments | Captured Value |
|---|---|---|
r0 | Owner object pointer | 0x02e10940 |
r1 | Source object pointer | 0x04316fb0 |
r2 | Destination address pointer | 0x05071b60 |
r3 | Start offset | 0 |
[sp] | Requested count | 1000 |
The provider code is free to reuse r0 through r3, so the tracer saves the arguments then carries the original destination address across to the return trap.
At 0x00466884, the new r0 contains the number of points copied. The tracer can then read count * 2 bytes from memory at the saved destination address through /proc/<tid>/mem. A short slice makes the little-endian 16-bit format apparent:
  00000000: 00 80 00 80 00 80 00 7f 00 80 00 80 00 80 00 7f  ................
  00000010: 00 80 00 81 00 80 00 81 00 80 00 80 00 80 00 80  ................
  00000020: 00 81 00 81 00 80 00 80 00 81 00 80 00 81 00 80  ................
Instead of trying to account for the formatting pass later on for BYTE mode, I repeated it with WORD format so the SCPI response would also be 2000 bytes. Comparing hashes of the data at the destination pointer during the breakpoint to a normal 2,000-byte SCPI response showed the values match exactly.
Other rabbit holes
Using the same style of static-analysis followed by dynamic tracing I looked into the pipeline that allows waveforms to be rendered during realtime operation.
I also worked out that the 'REF' and 'MATH' waveform features on the scope only use the smaller 1 Kpoint buffer intended for display. Unfortunately they also seem to be computed on the applications processor rather than the Zynq fabric or sampling FPGA which is far less interesting for accelerated analysis workflows (explains why the on-scope FFT sucks).
To finish up the reverse-engineering work, I quickly mapped out how to read the rotary encoder/button events, and how to drive the LEDs using small serial commands to the front-panel controller. Dave's DS7000 teardown identifies it an Actel ProASIC3 FPGA.
I don't see much benefit to completely replacing the Rigol Qt application when I can put that effort into more generic software or my own FPGA projects.
Extracting waveforms with a sidecar application
Now I've found a way to access the capture memory I need to do a better job of feeding the network interface than Rigol does. I'm still trying to leave Rigol's application alone where possible so changes should be 'opt-in' so I'm not accidentally affecting anything past my tested SCPI readout behaviours.
My sidecar application runs in the background using a similar runtime-patched breakpoint approach which keeps the breakpoints around for the next chunks, with some added safety checks and error handling. For the first pass I was just trying to get the tool and a basic TCP protocol working so I jump in after the hardware buffer is ready and copy/packetise it myself.
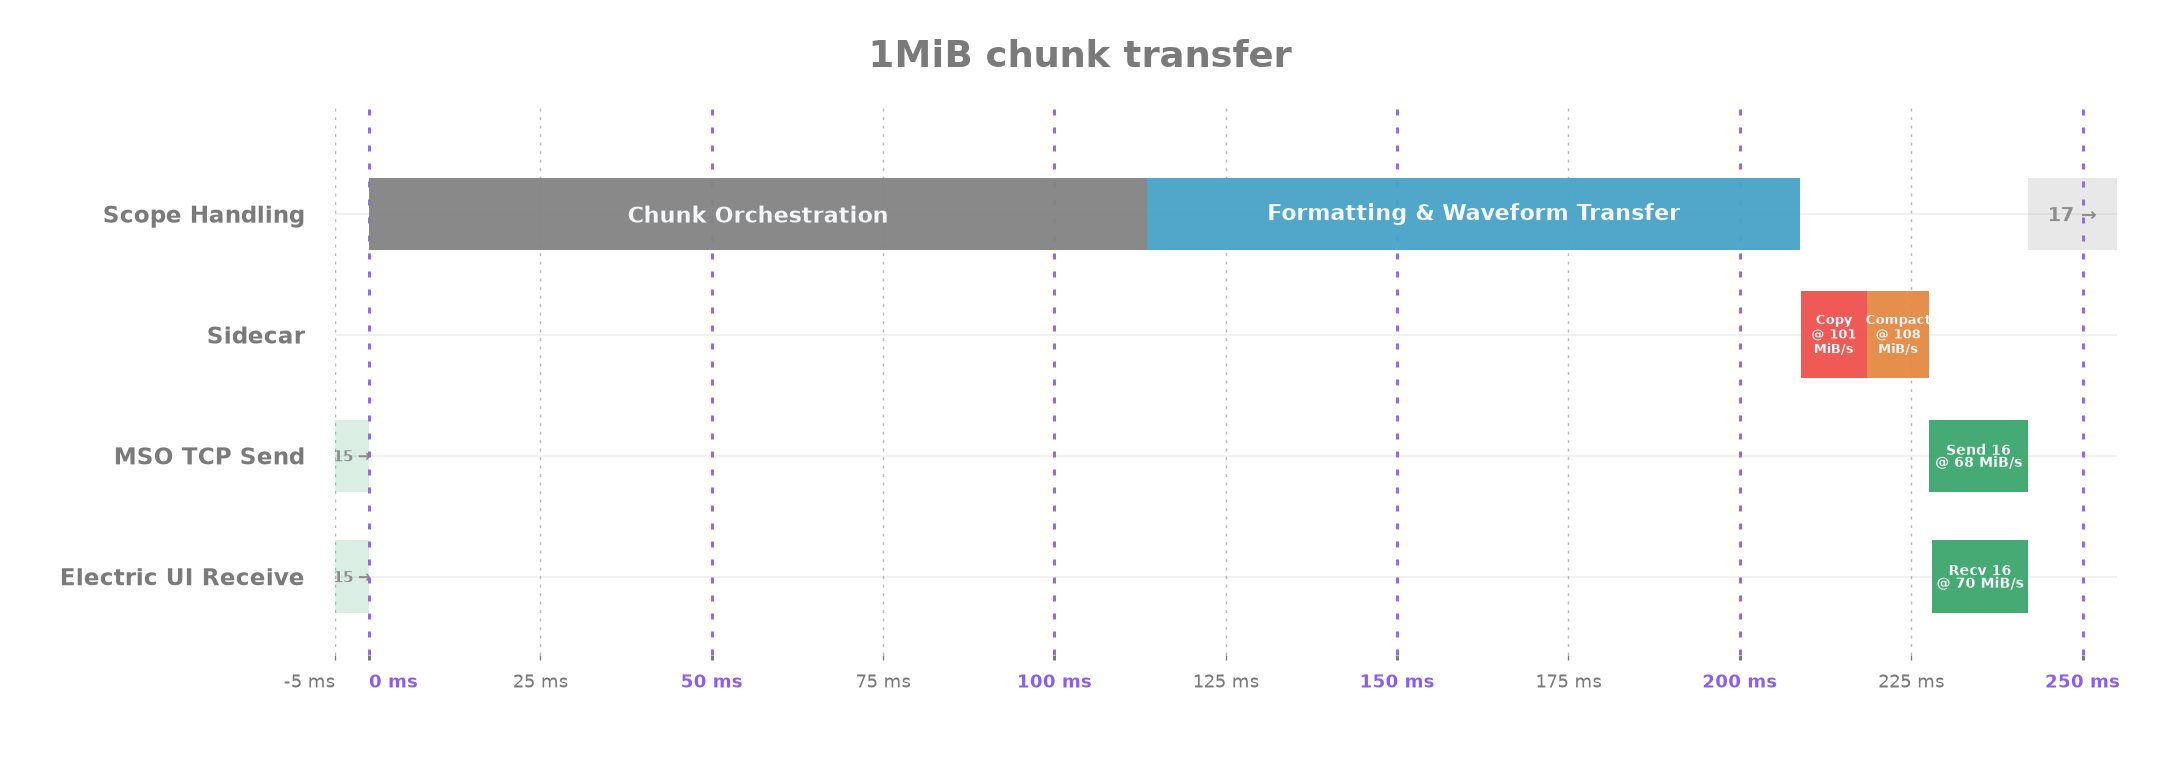
It turns out that this gave a similar 4.5 MiB/s throughput as the Rigol implementation for a 22 second transfer of a 100M capture. Because the scope is in STOP mode, I can compare the SCPI readout to the sidecar output to make sure I'm getting identical capture data.
My Perfetto traces show that attaching and installing breakpoints averages around a millisecond per request, and the copy and network transfer isn't that significant compared to the time the data preparation and fetch takes. It also shows the 200 ms between bursts of network traffic we saw at the start.
Working with the breakpoint buffer seems reliable enough, so now I need to try and take over more of Rigol's hardware handling to speed up chunk requests.
Taking over the loop
Sprinkling timestamp events across a temporary profiling version to breakpoint across blocks of instructions lets me better understand where the Rigol code is spending it's time without the copy or networking.

Only ~43% of time is spent fetching samples through the FPGA, there's a QByteArray append loop that's responsible for 30%, and another 20% is just returning through the response and application loop before starting the next chunk.
provider_read() itself takes around 90 ms, but Rigol doesn't ask it for the next chunk until the data has been reformatted, handed off, and then returned the outer application loop until it's scheduled again. That work is necessary for a normal SCPI response, but the sidecar will copy the samples and send it's own response so letting Rigol format the same data only to reach the next provider call is redundant.
Forcing the next read to occur immediately seems like a useful way to dodge the uncontrolled gap until the next read, without having to replace the hardware-facing functions themselves.
So I let the Rigol code make the first provider_read() call to give the sidecar a known-good owner, source object and thread context without having to figure out the application's one-off setup work. At the breakpoint at the return from provider_read():
- I save the context,
- Advance the source position for the next chunk,
- Re-enter
provider_read()immediately - After the chunks are done, restore the first result and registers so Rigol's original call can return normally.
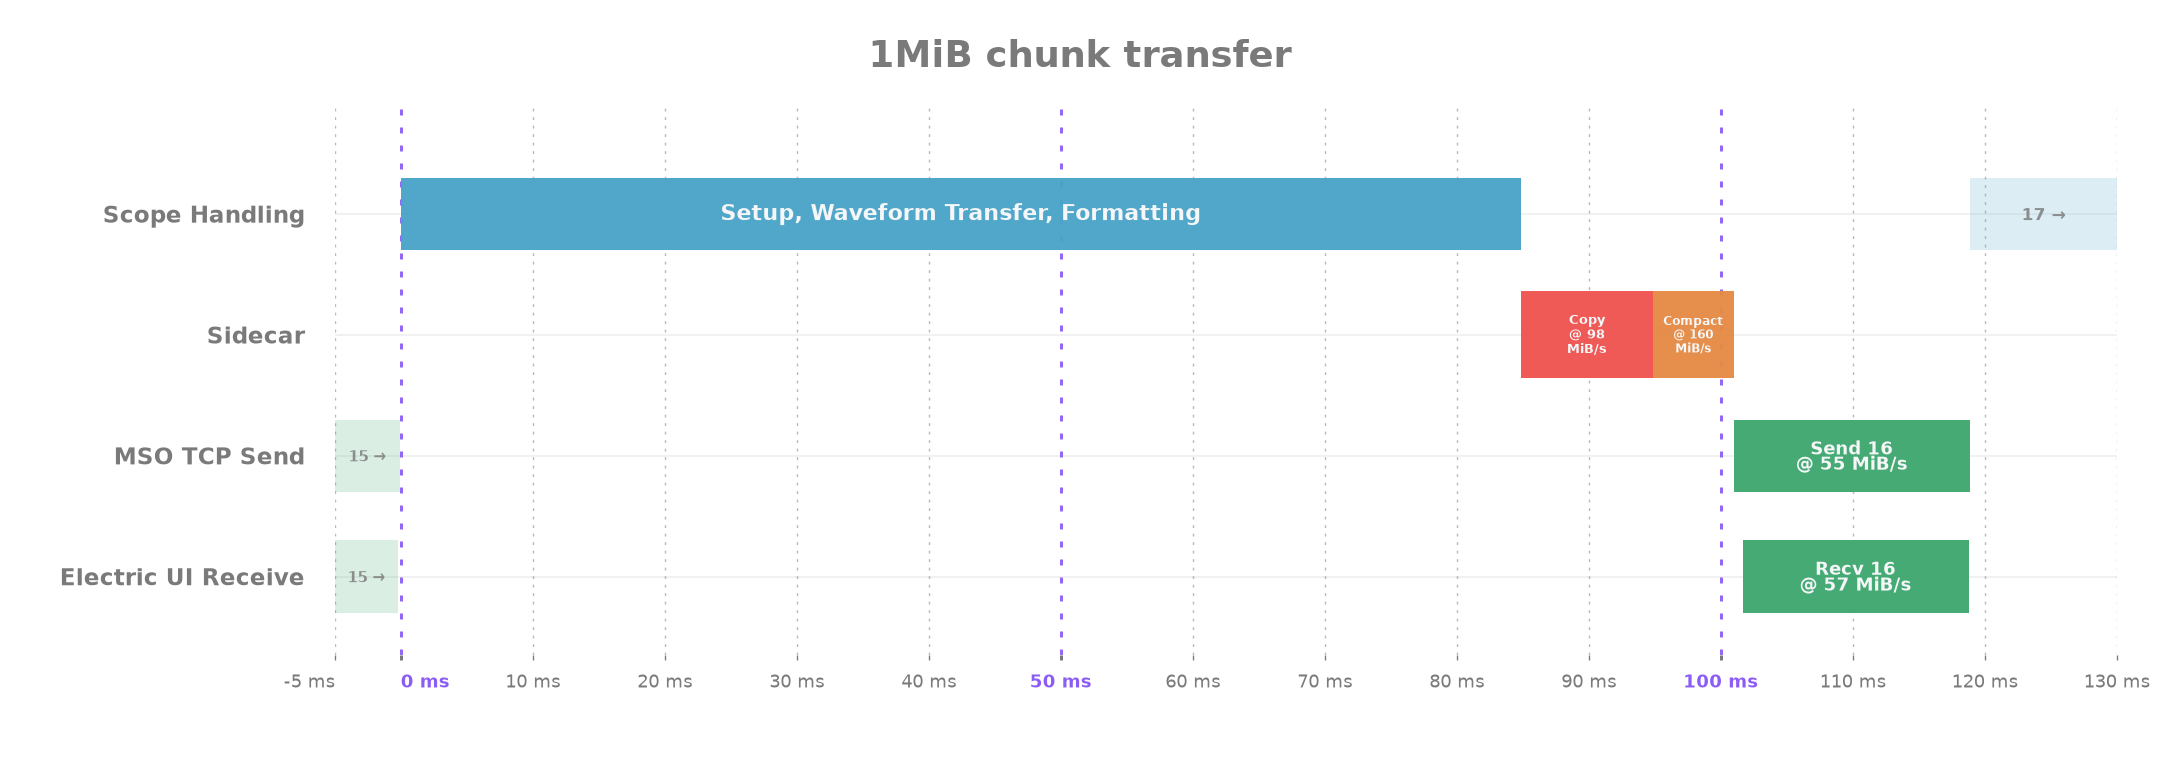
Forcing the request loop barely changes the provider duration itself, but halves the median chunk-to-chunk interval from about 213 ms to 119 ms. The 100 Mpoint readout drops from 22 seconds to 11.6 seconds.
We know from the static analysis work that provider_read() plans a request, followed by the FPGA transfer, deinterleave and IPhyTrace data-readout function. That last function resolves one of the PL's memory regions, maps it into the application, and copies two bytes per sample into Rigol's temporary buffer. The sidecar then reads that buffer into its packetiser.
So we can skip a copy if we run the hardware-preparation functions directly, then intercept the physical memory address and transfer size once the data-read function is done. The sidecar can then extract the useful bytes straight from the PL buffer and skip Rigol's map-and-copy step.
Additionally, I've used ARM's NEON intrinsics to read the 16-bit container into a pair of byte arrays for a single-pass copy into a formatted dense byte-stream, cutting the formatting/compaction pass over the copied data.
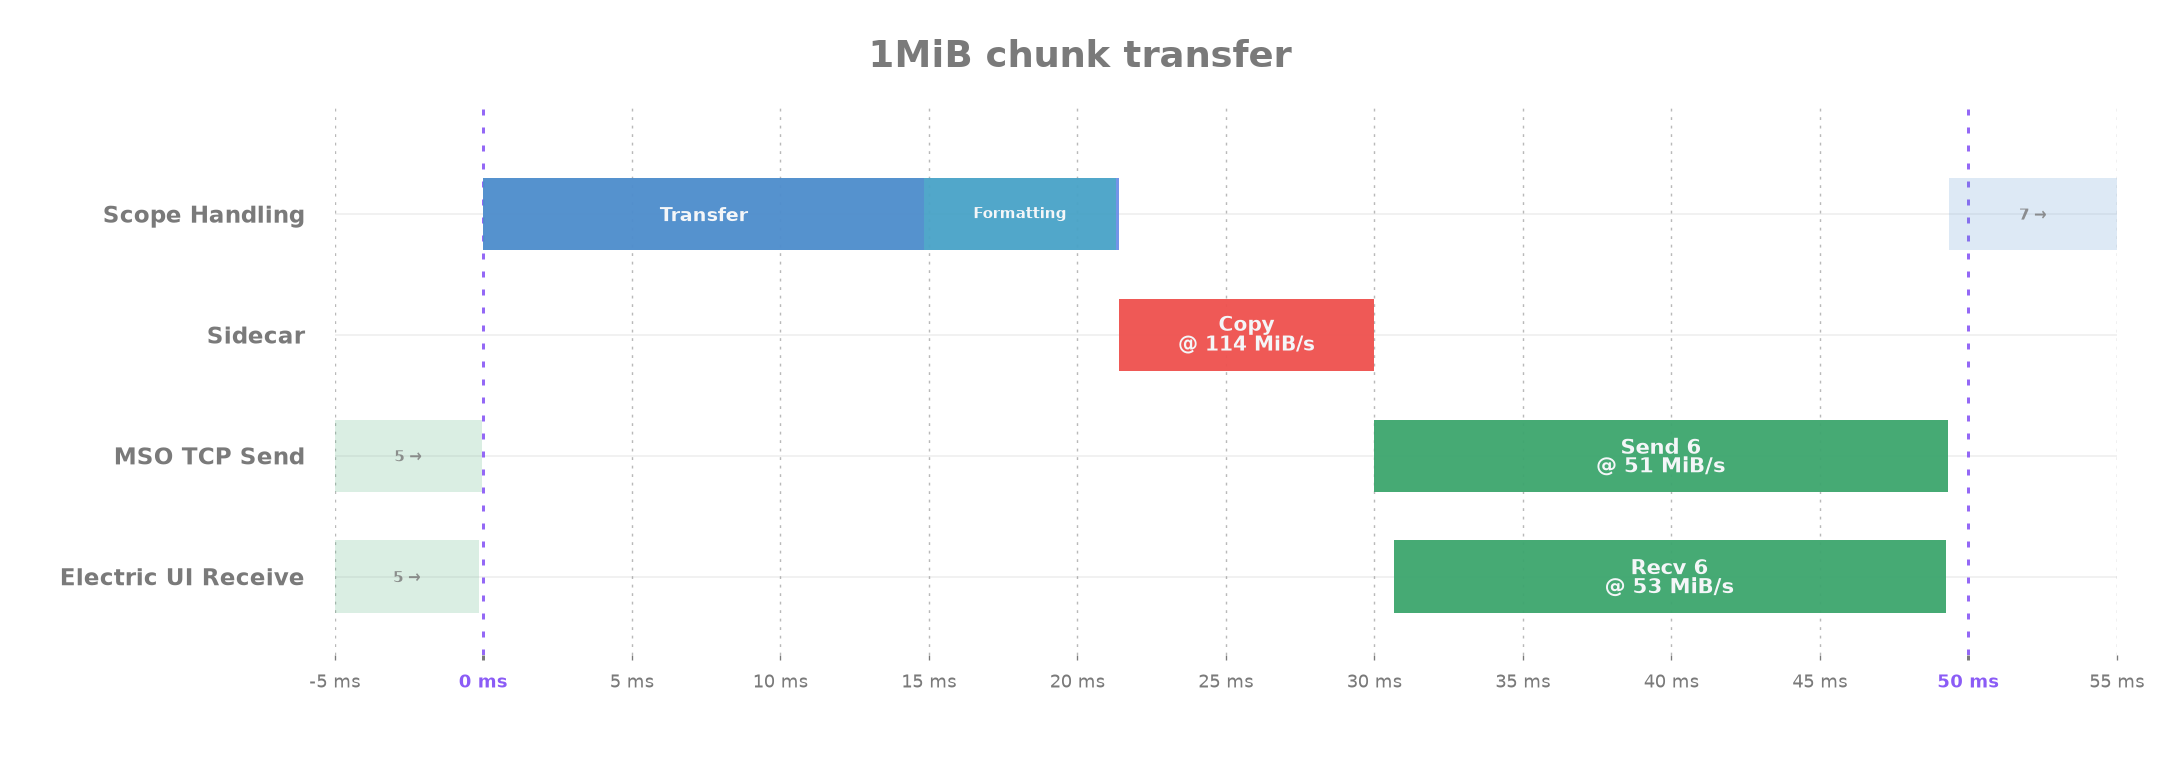
This works pretty well, going from a hardware request to posting the packets now takes about 30 ms, and the larger 100M run is averaging 5.2 seconds.
Overlapping network transfers
I'm wanting to run the FPGA transfers as close to continuously as possible, so an obvious improvement is to spend as little time doing other work as possible. The network transfer is now a large enough part of the chunk's timeline that it needs improvement.
With a pair of cache-friendly output sidecar buffer slots I'm able to fill one slot on the first ARM core while a separate sender thread pinned to the other core transmits the previous slot.
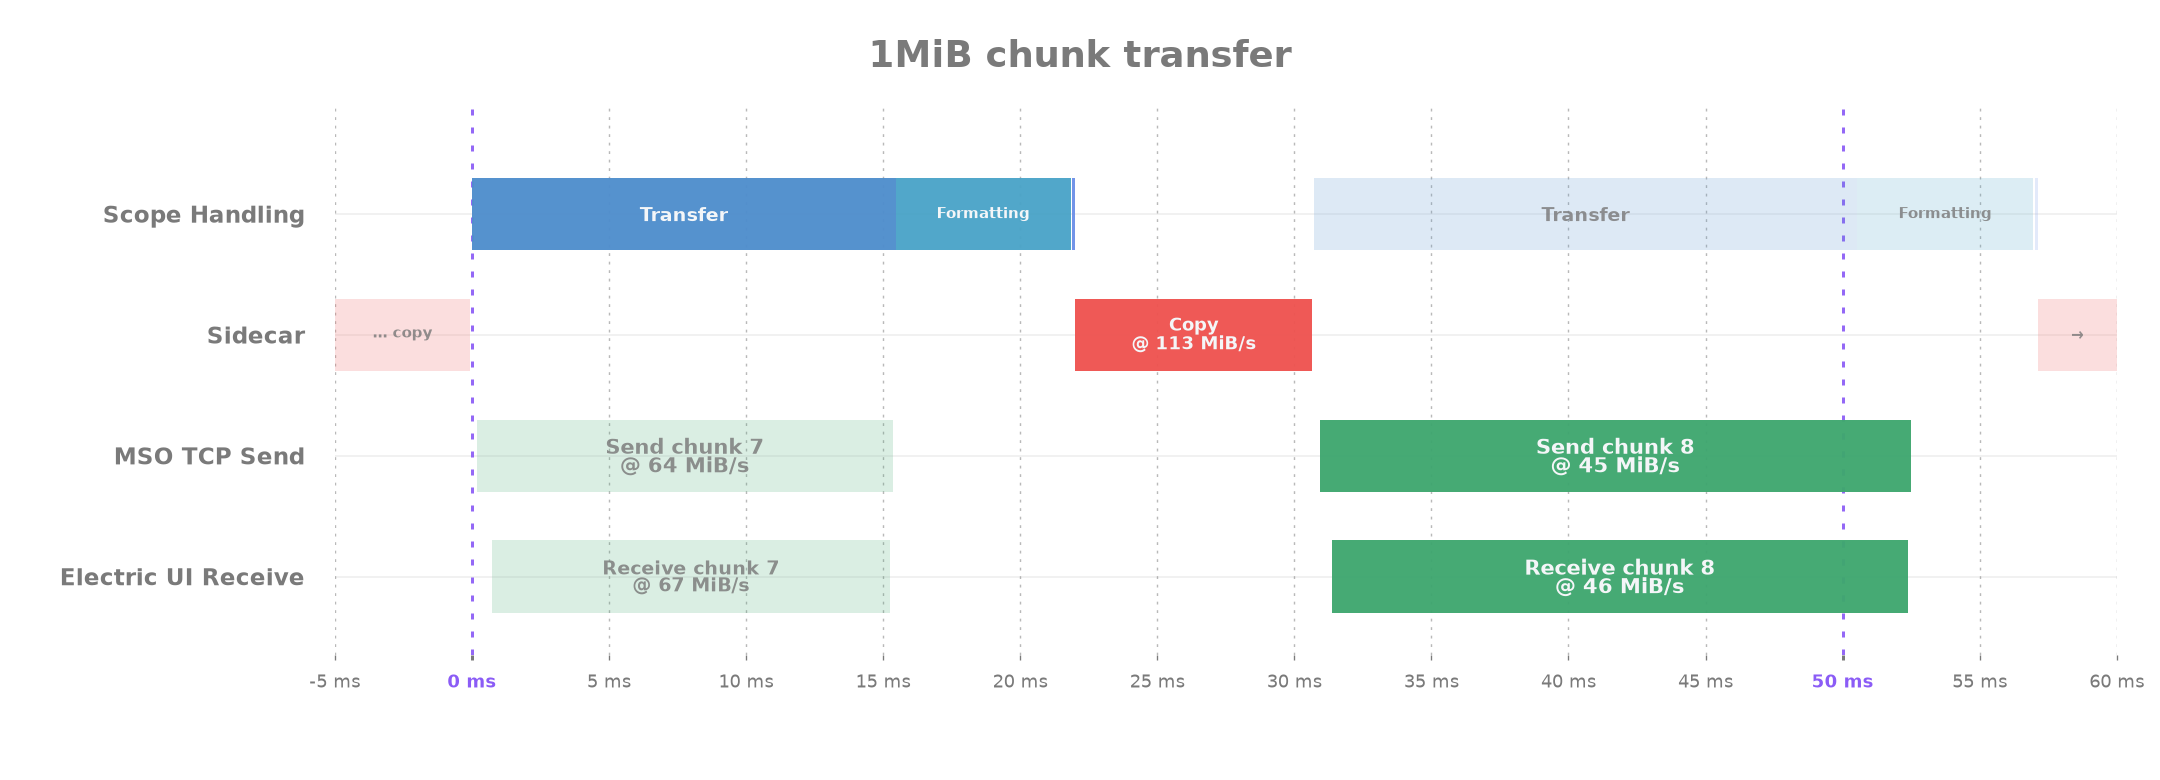
The 100M readout takes ~3.16 seconds for an average throughput of 30 MiB/s. That's 6.9x faster than the first run and the network interface is active around half the time now.
Reading the raw FPGA transfer output
I know the minimum supported link-speed between the two FPGAs is far faster than the 50 MiB/s transfer throughput we're seeing and I'd hope that Rigol's engineers wouldn't go to the effort of a multi-lane SerDes interface and settle for effective performance in the realm of microcontroller SPI peripherals.
Looking into profiling data during the transfer, it spends 15 ms before hitting its ready-polling loop and typically leaves it very soon (~100 us). The second function responsible for de-interleaving also has some short checks before waiting for ~6.25 ms.
Attempts to see if the PL/FPGA are capable of more were unsuccessful:
- Requests larger than the 1,024,000 point limit timed out,
- Trying many small requests was slower overall,
- Modifying the sleeps in the FPGA request function down to 1-5 milliseconds actually made the overall requests slower
- Replacing the de-interleave sleep with busy-polling was unchanged at ~6.25 ms.
Curiosity about the need for the de-interleaving stage led into dumping the intermediate buffer at 0x1c000000 after the FPGA transfer completed. This shows the underlying data model as 4x 16-bit lanes with different interleaving formats when multiple channels are enabled, even though SCPI is requesting a single channel:
| Active channels | Bits | Example data | Lane order | Lane coding |
|---|---|---|---|---|
| CHx | 8 | 81 00 80 00 82 00 80 00 | CHx x 4 | sample, 00 |
| CHx | 12 | 81 30 81 20 81 20 81 20 | CHx x 4 | high, low |
| CH1, CH2 | 8 | a2 00 a8 00 7d 00 7e 00 | CH1, CH2, CH3, CH4 | sample, 00 |
| CH1, CH3 | 8 | 82 00 7f 00 83 00 7f 00 | CH1, CH3 | sample, 00 |
| CH1, CH3 | 12 | 80 f0 7e d0 80 f0 7e d1 | CH1, CH3 | high, low |
| All | 8 | 82 00 7f 00 7f 00 7f 00 | CH1, CH2, CH3, CH4 | sample, 00 |
| All | 12 | 80 f0 7f 90 7e d0 7d d0 | CH1, CH2, CH3, CH4 | high, low |
A single-channel 8-bit readout moves twice the data due to the 16-bit container, but if any other channel is enabled then we see ~8x data amplification for the single-channel SCPI results. A worst-case scenario using all channels would need 4x separate SCPI passes, and this internal link will have moved 32x more data than needed.
Internal interleaving behaviours like this are expected around the transceiver datapaths and while it isn't ideal that denser formats are used, it's very clear the applications processor design and software is holding the hardware back.
Also, I was able to read-out a generated sine fed into CH4 while only CH1 & CH2 were enabled, which shows that all of the scope channels are sampling and stored by the capture FPGA!
Reading from the staging buffer and doing the de-interleave myself removes a consistent 6.25 ms from each chunk.
As a little surprise though, the consistency of the FPGA transfers and network bursts massively improved across a transfer sequence. I've only been showing single chunk sequences and totals, but each 100M run has 98 chunk transfers which demonstrate a lot of variance.
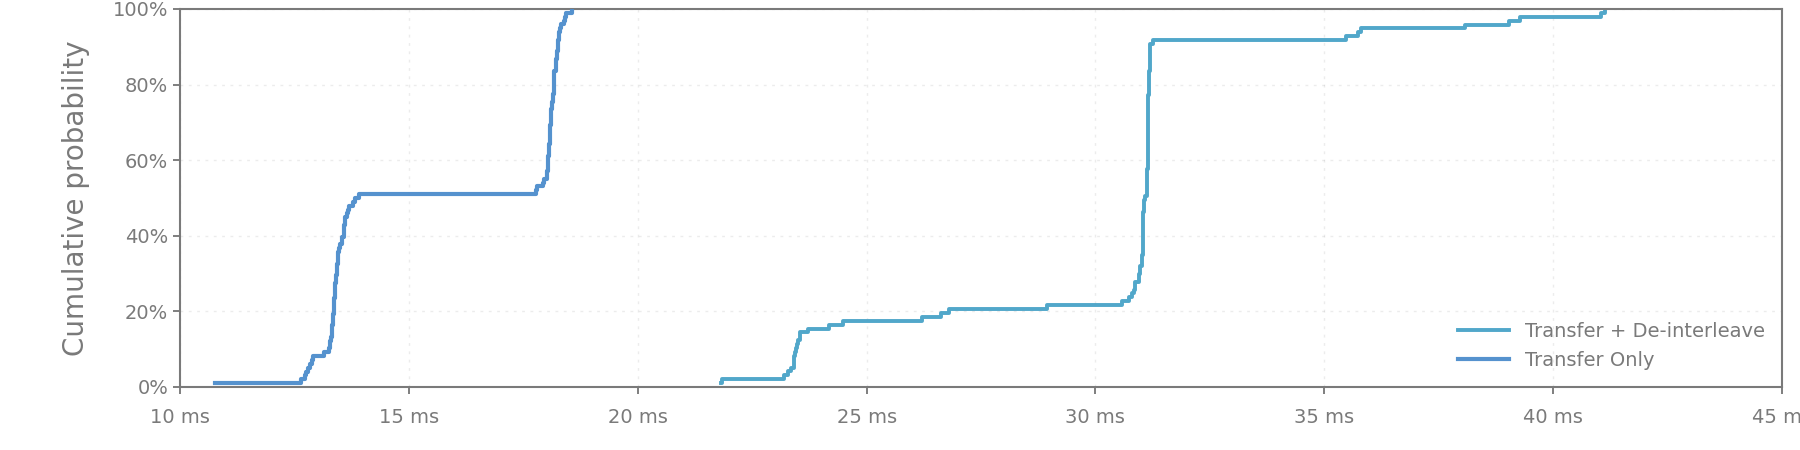
I'm attributing the improvement to the reduction in memory pressure on the DDR controller. In practice this cuts the 100M readout down to 2.4 seconds, or 39 MiB/s effective throughput. This is the first time I've seen some network transfers overlap the buffer copy!
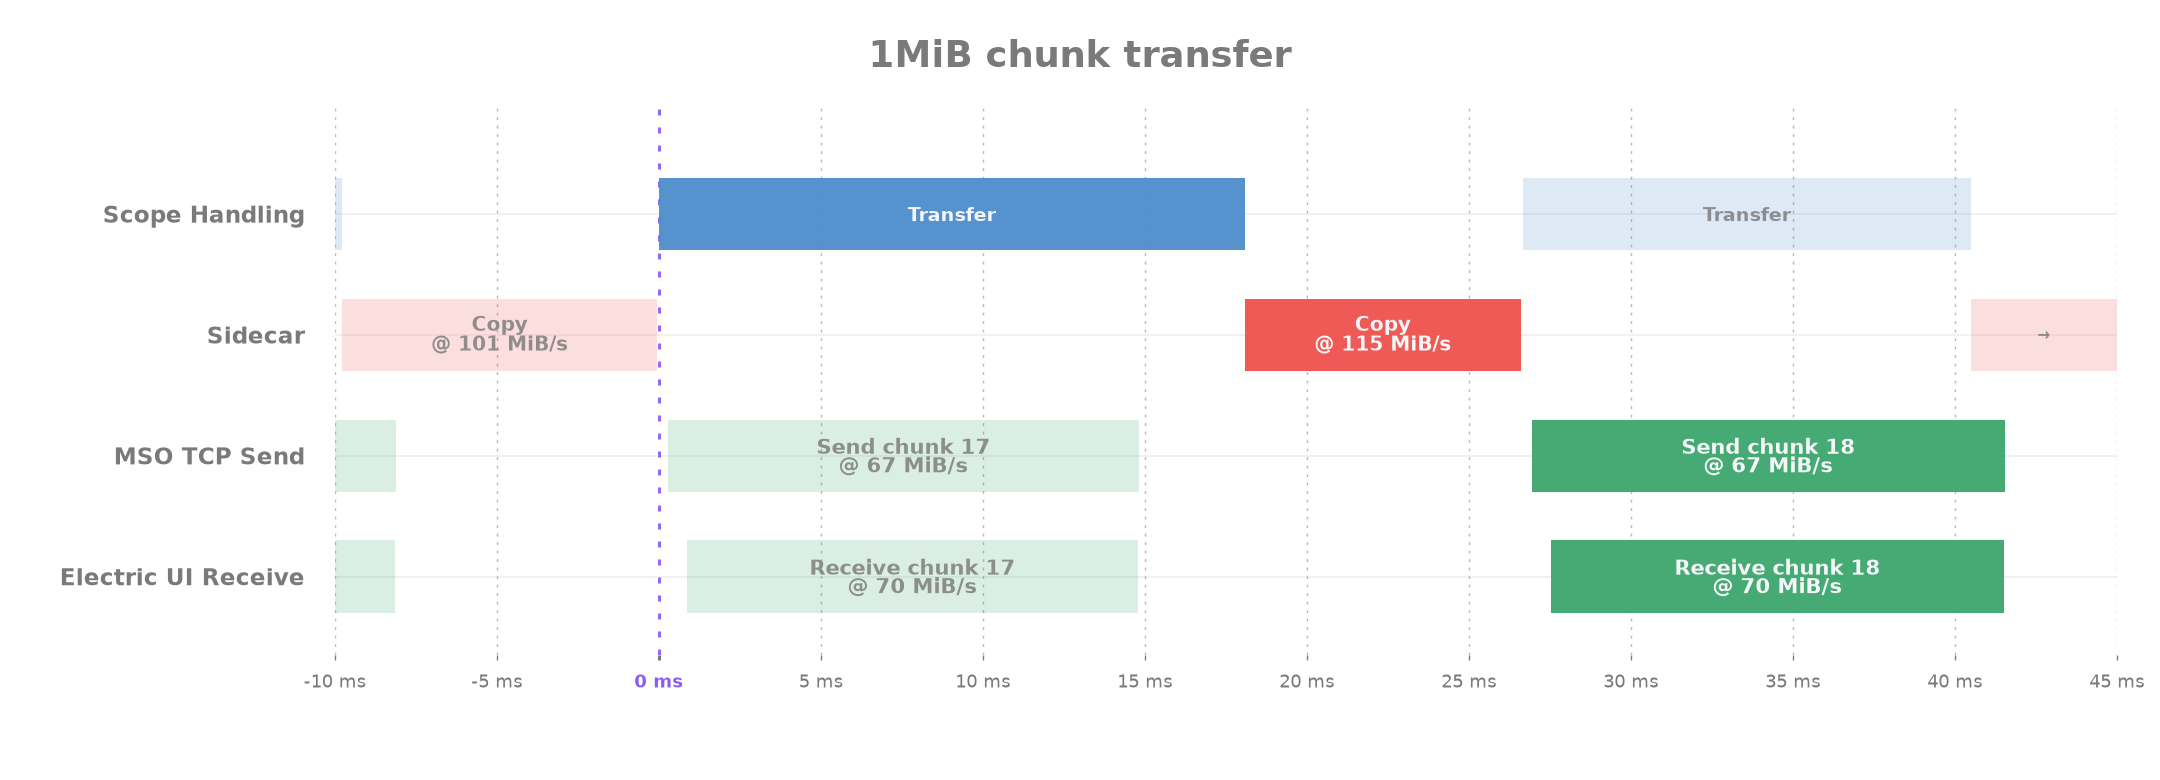
I can't easily reverse engineer what the FPGAs are doing beyond this, so the ~9 ms spent copying from the PL staging memory to the sidecar is now the last section I might be able to improve on.
The deeper detail behind testing and optimising the access patterns to get the most out of the Zynq's memory subsystem is too much to cram into this post, so I'll try to cover them in another post.
One 'easy' improvement is using the other A9 core to have more simultaneous load transactions in flight. Splitting the buffer in half allows both cores to run the same NEON copy without changing the output format, netting a 1.9x copy improvement for ~450 MiB/s aggregate memory read bandwidth.
The ~220 MiB/s in the performance trace shows the effective write rate because we're 'throwing out' half the buffer to remove the left over 0x00 padding.
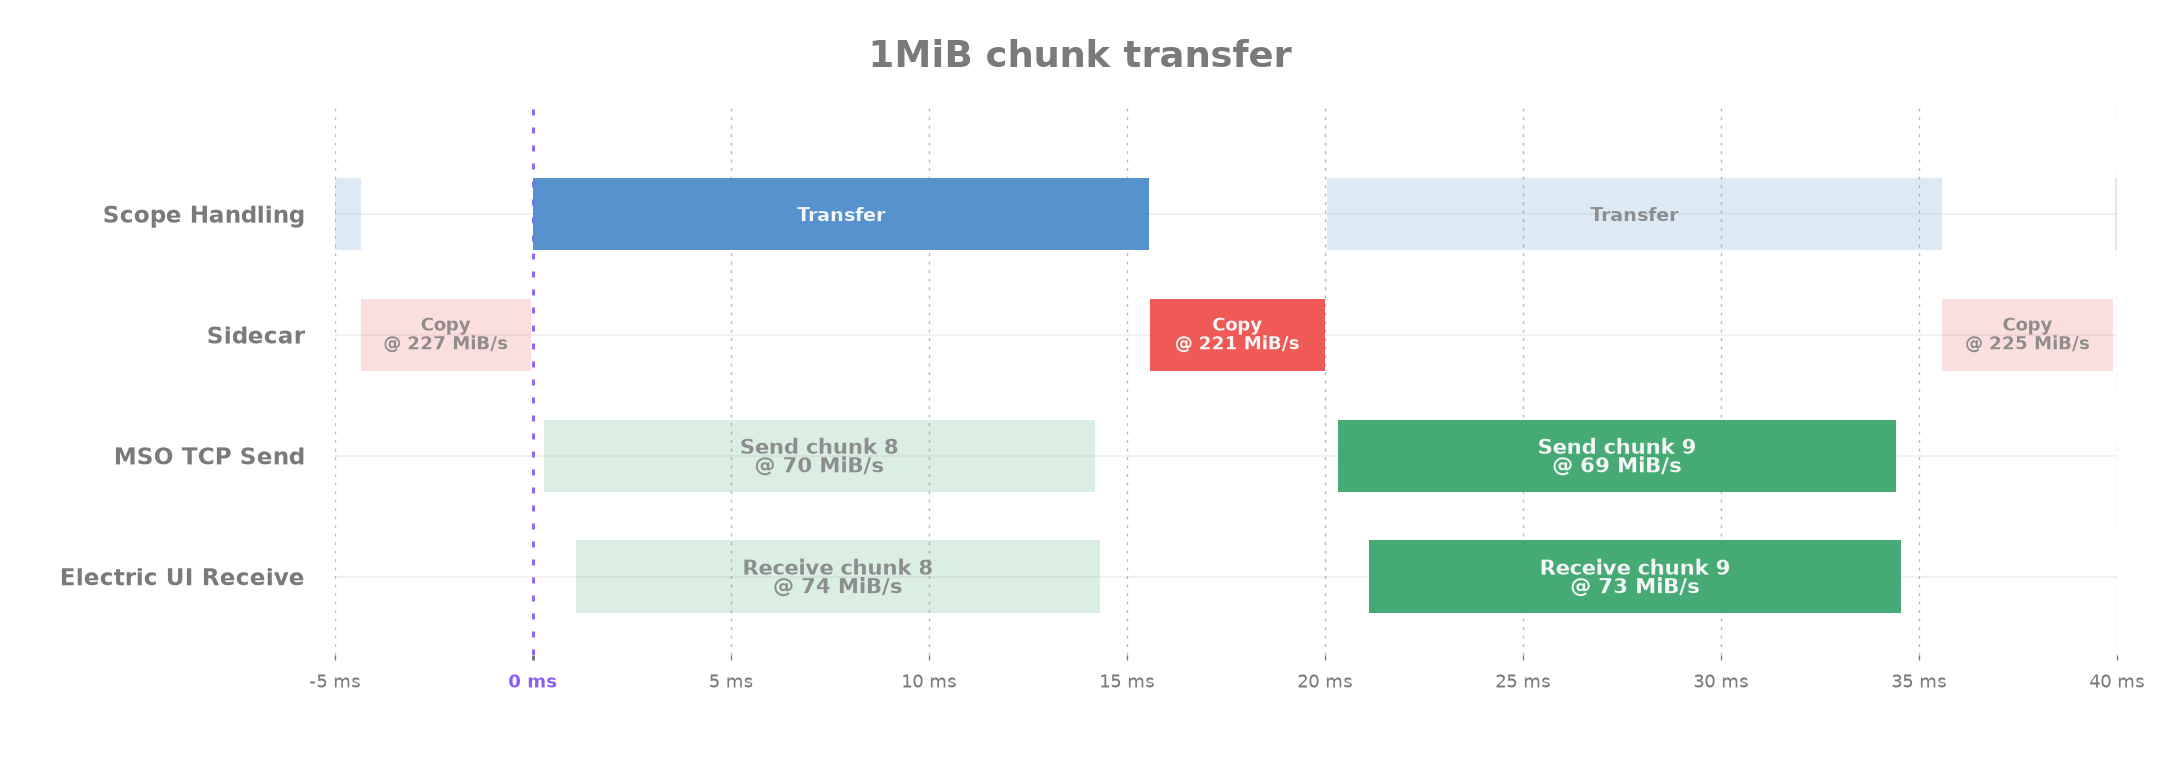
The 100M readout is now down to 2.2 seconds for ~45 MiB/s effective throughput.
Closing
It took a fair bit of work to get here, but I'm finally satisfied with the average network utilisation. For the useful 10M captures I usually run, the sidecar finishes before the Rigol handler sends it's first chunk!
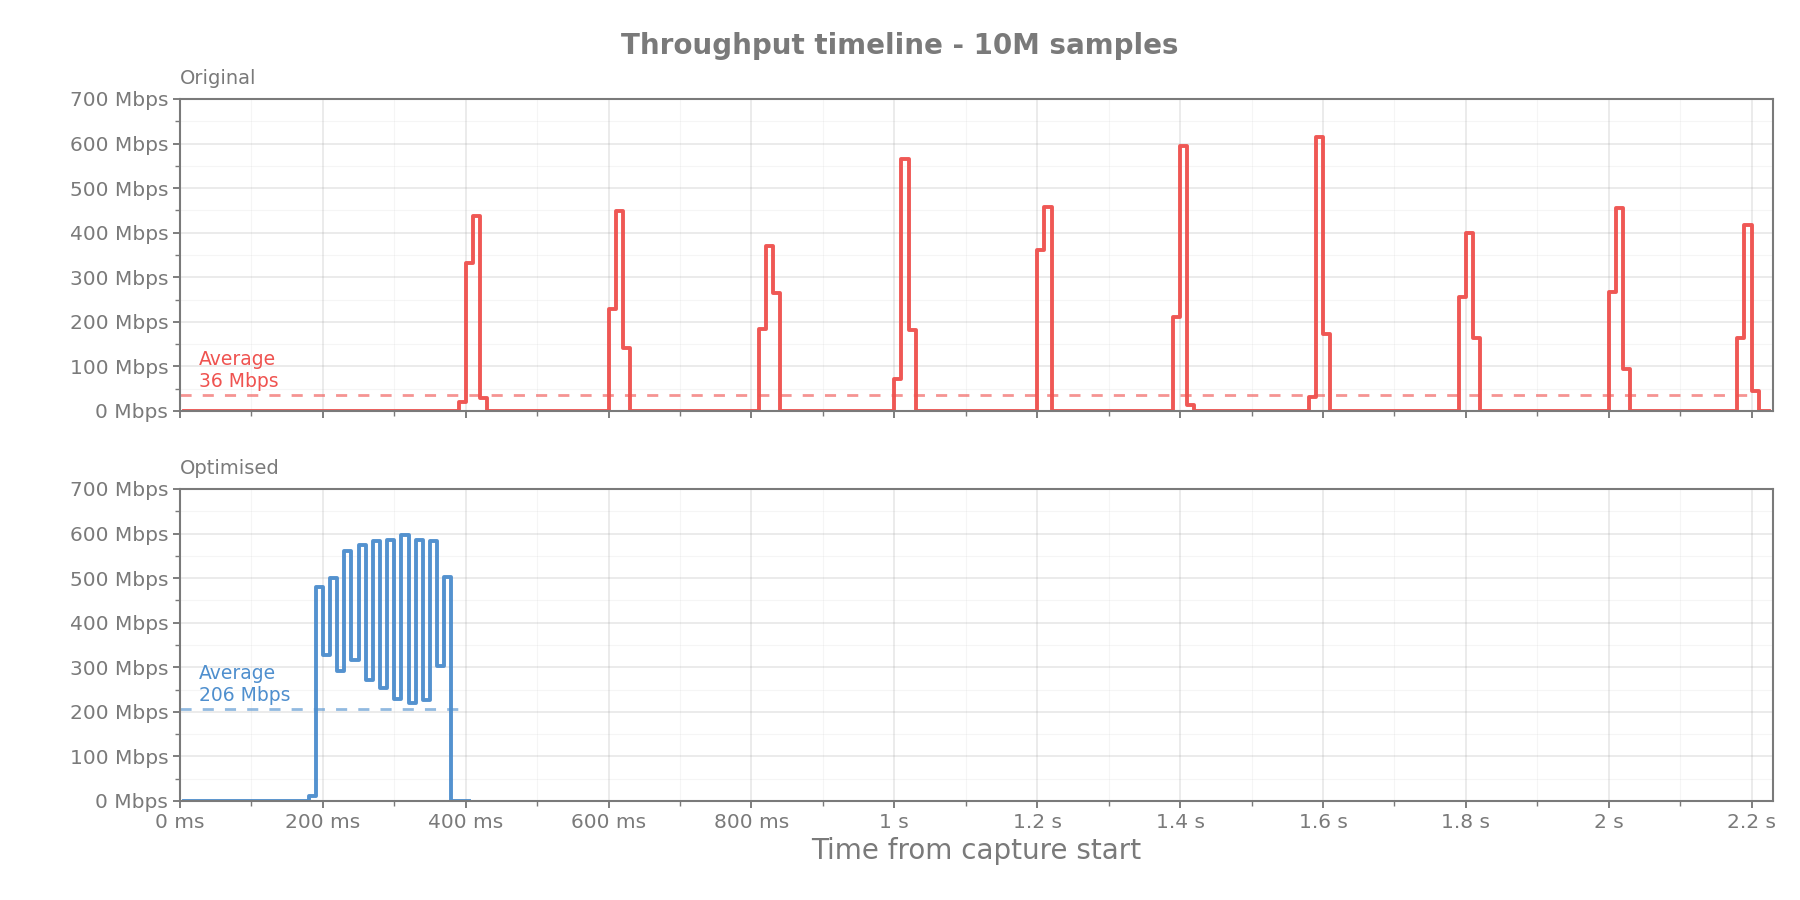
Setting up and tearing down the sidecar means single-chunk transfers have higher latency, but the 5-10x increase in throughput for anything larger than 1M is huge.
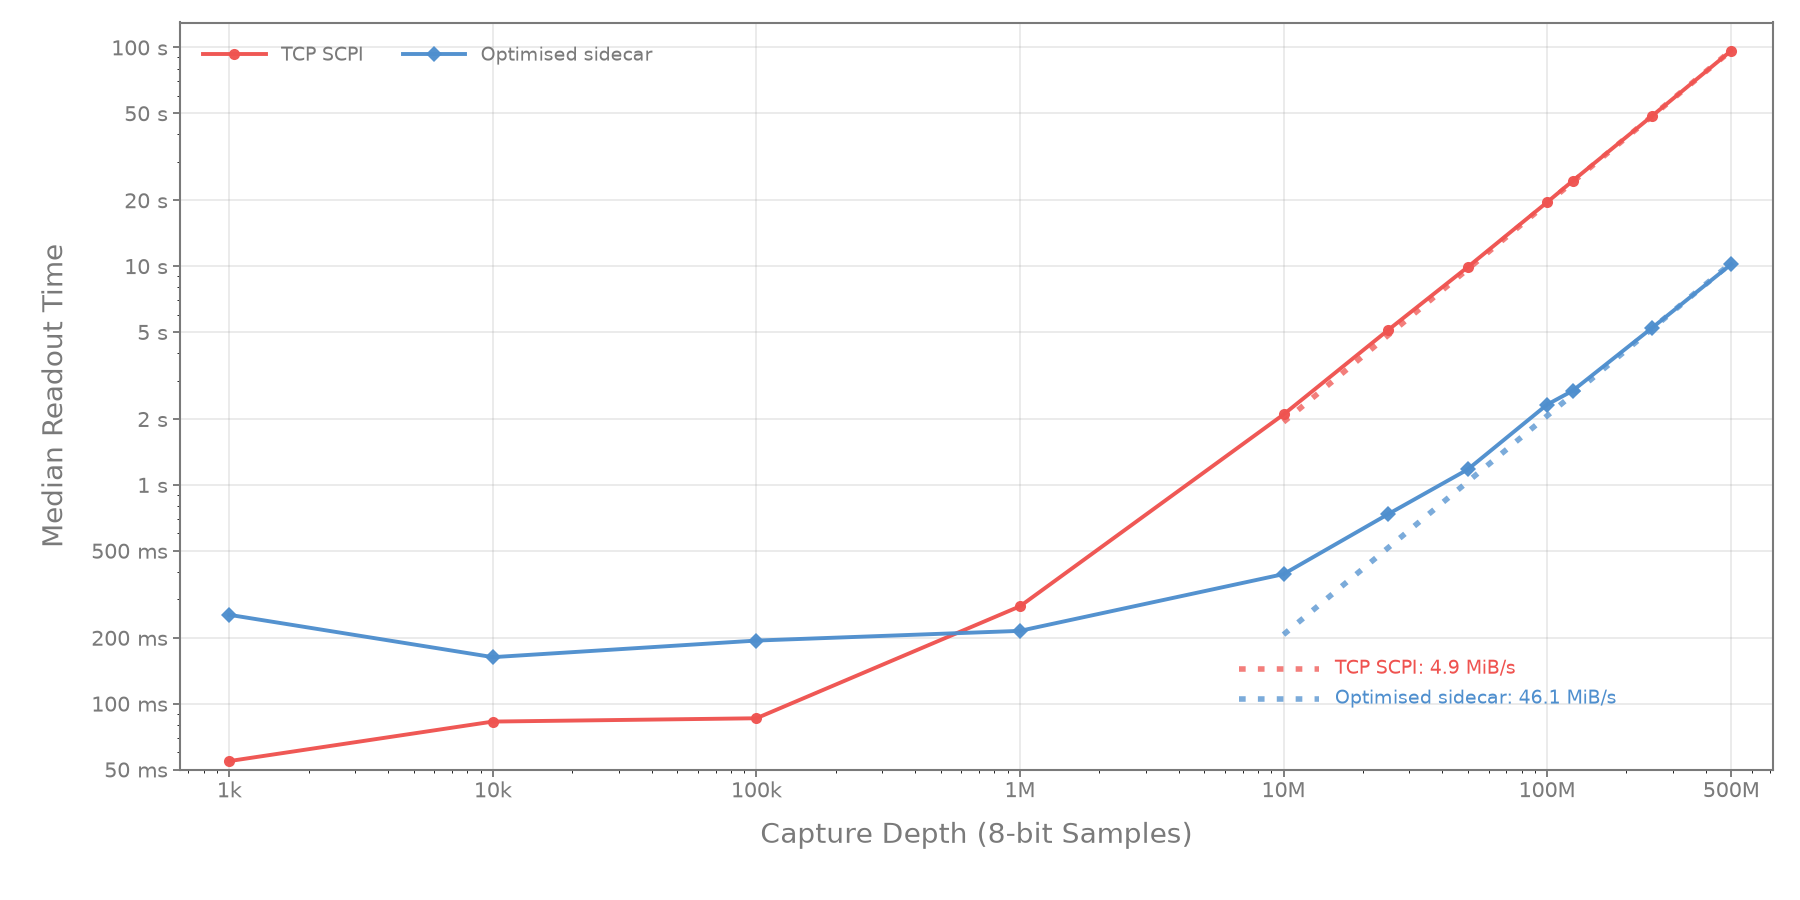
The speedup for real-world tasks feels so much better, it's just a shame that I needed to do Rigol's job for them.
TODO: Video showing side-by-side improvement in wall-clock duration to run the capture/extract,
It's also a little sad we don't have even deeper control over the scope's software or FPGA to get more out of the captures before hitting the network.
Subscribe to the RSS feed for my eventual return to this madness?
The Zynq PS GEM is limited to a 1522-byte frame, so no jumbo-frames for us ↩